Researchers have collected data from a random sample of six students on the number of hours spent
Question:
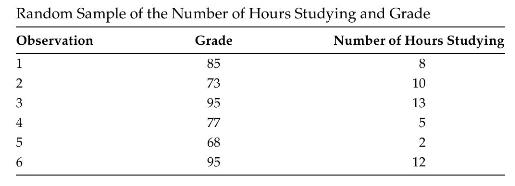
Researchers have collected data from a random sample of six students on the number of hours spent studying for an exam and the grade received on the exam as given in Table 6.5. Using this data, answer each of the following questions manually and confirm your results with Minitab:
a. Draw a scatterplot and find the equation of the line of best fit that models the relationship between the grade received and the number of hours studying.
b. Find the residual for Observation #4.
c. Interpret whether or not you believe there is a significant relationship between the grade received and the number of hours studying.
d. Find and interpret a \(90 \%\) confidence interval for the true population slope parameter.
e. Find and interpret a \(99 \%\) confidence interval for the predicted grade for an individual who spends 10 hours studying.
f. Find and interpret a \(99 \%\) confidence interval for the mean grade of all individuals who spend 10 hours studying.
Table 6.5
Step by Step Answer:

This question has not been answered yet.
You can Ask your question!