

At the beginning of this chapter, we presented a graph showing the price per gallon of gasoline
Question:
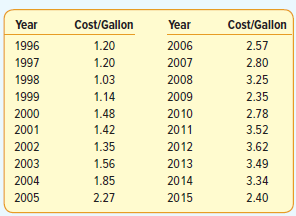
Determine the trend line using both linear and nonlinear equations. Which would you suggest? Why? Based on your recommendation as the better equation, what cost per gallon would you estimate for 2016 and 2017?
Fantastic news! We've Found the answer you've been seeking!
Step by Step Answer:
The linear trend line is Y 07965 01366t and the logarithmic trend line is log Y 00083 00289t The eq...View the full answer

Answered By
BETHUEL RUTTO
Hi! I am a Journalism and Mass Communication graduate; I have written many academic essays, including argumentative essays, research papers, and literary analysis. I have also proofread and written reviews, summaries and analyses on already finished works. I am eager to continue writing!
1+ Reviews
10+ Question Solved
Related Book For 

Statistical Techniques in Business and Economics
ISBN: 978-1259666360
17th edition
Authors: Douglas A. Lind, William G Marchal
Question Posted:
