Often we may be interested in comparing the amount of variability between two different data sets. This
Question:
Often we may be interested in comparing the amount of variability between two different data sets. This can be done using the sample coefficient of variation \((C O V)\), which is a percentage that can be used to describe the relative variability between two different samples. The COV is calculated by dividing the standard deviation by the mean and then multiplying by 100 , as can be seen in the following formula:
\[
\mathrm{COV}=\frac{s}{\bar{x}} \cdot 100 \]
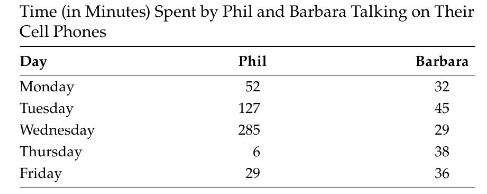
The sample that has the larger value of the COV represents the sample that has more variability relative to the mean. The data set provided in Table 3.18 gives the time (in minutes) that Phil and Barbara spend talking on their cell phones each day over the course of a 5-day period. Using the COV, which of these two individuals shows more variability in the time spent (in minutes) talking on his or her cell phone?
Table 3.18
Step by Step Answer: