

Question: Minitab can also be used to create a graphical summary of a given variable. The graphical summary can be found by selecting the Stat menu;
Minitab can also be used to create a graphical summary of a given variable. The graphical summary can be found by selecting the Stat menu; under Basic Statistics a. Using Minitab, create a graphical summary for the annual fuel cost for the data given in Table 3.17. b. Create a graphical summary for the annual fuel cost by Make. c. Create a graphical summary for the amount of greenhouse gas by Make. Table 3.17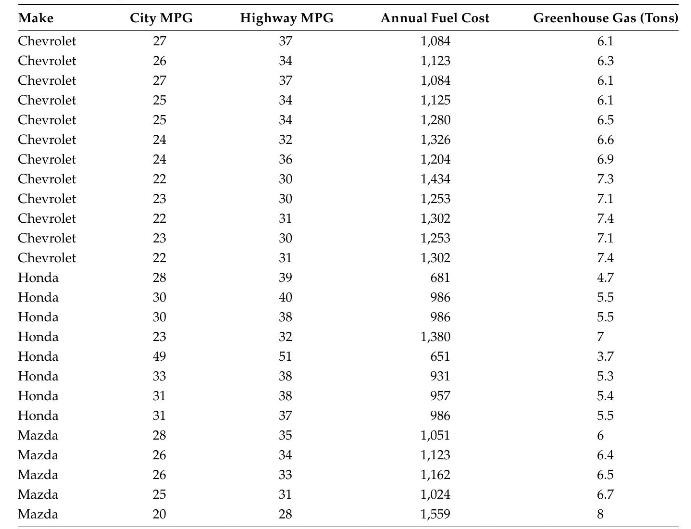
Make City MPG Chevrolet Chevrolet Chevrolet Chevrolet Chevrolet Chevrolet Chevrolet Chevrolet Chevrolet Chevrolet Chevrolet Chevrolet Honda Honda Honda Honda Honda Honda Honda Honda Mazda Mazda Mazda Mazda Mazda 22222222233285522222 27 Highway MPG 37 Annual Fuel Cost Greenhouse Gas (Tons) 1,084 6.1 26 34 1,123 6.3 27 37 1,084 6.1 34 1,125 6.1 34 1,280 6.5 24 32 1,326 6.6 24 36 1,204 6.9 30 1,434 7.3 30 1,253 7.1 31 1,302 7.4 30 1,253 7.1 31 1,302 7.4 39 681 4.7 30 40 986 5.5 30 38 986 5.5 32 1,380 49 51 651 3.7 38 931 5.3 31 38 957 5.4 31 37 986 5.5 35 1,051 6 26 34 1,123 6.4 26 33 1,162 6.5 31 1,024 6.7 20 28 1,559 8
Step by Step Solution
There are 3 Steps involved in it

Get step-by-step solutions from verified subject matter experts