

Question: The iris data set, mentioned in Section1.1, contains various features, including 'Petal.Length' and 'Sepal.Length', of three species of iris: setosa, versicolor, and virginica. (a) Load
The iris data set, mentioned in Section1.1, contains various features, including 'Petal.Length' and 'Sepal.Length', of three species of iris:
setosa, versicolor, and virginica.
(a) Load the data set into a pandas DataFrame object.
(b) Using matplotlib.pyplot, produce boxplots of 'Petal.Length' for each the three species, in one figure.
(c) Make a histogram with 20 bins for 'Petal.Length'.
(d) Produce a similar scatterplot for 'Sepal.Length' against
'Petal.Length' to that of the left plot in Figure 1. 9. Note that the points should be colored according to the 'pecies' feature as per the legend in the right plot of the figure.
(e) Using the kdeplot method of the seaborn package, reproduce the right plot of Figure1. 9, where kernel density plots for 'Petal. Length' are given.
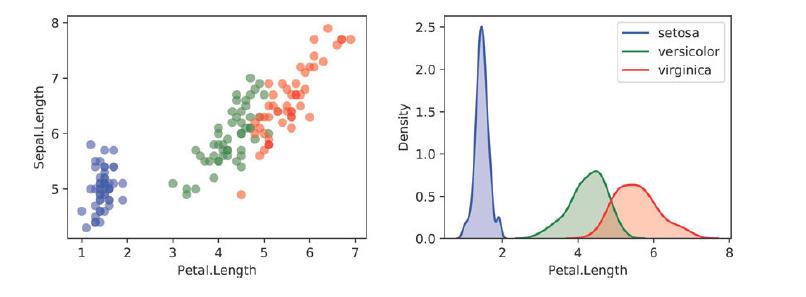
Figure 1.9: Left: scatterplot of 'Sepal.Length' against 'Petal.Length'.
Right: kernel density estimates of 'Petal.Length' for the three species of iris.
Sepal.Length 51 5 8 1 2 4 5 Petal.Length Density 2.5 2.0 1.5 1.0 0.5 0.0 10 6 2 Petal.Length 76 setosa versicolor virginica 8
Step by Step Solution
There are 3 Steps involved in it
a... View full answer

Get step-by-step solutions from verified subject matter experts