

Question: What a difference a single outlier can make! The data set in Table 7.7 presents a collection of ordered pairs ((x, y)). a. Using Minitab,
What a difference a single outlier can make! The data set in Table 7.7 presents a collection of ordered pairs \((x, y)\).
a. Using Minitab, draw a scatterplot and run a simple linear regression analysis to develop a model that describes the relationship between \(x\) and \(y\).
b. Check graphically to see if the regression model assumptions have been reasonably met.
c. Run the Ryan-Joiner test of normality and comment on the results.
d. Determine the leverage values, standardized residuals, and Cook's distances and draw a Cook's distance plot.
e. Notice the outlier that has the largest Cook's distance. Remove this outlier from the data set, and rerun steps (a) through (c). Comment on the impact that keeping this point in the data set has on your analysis.
Table 7.7
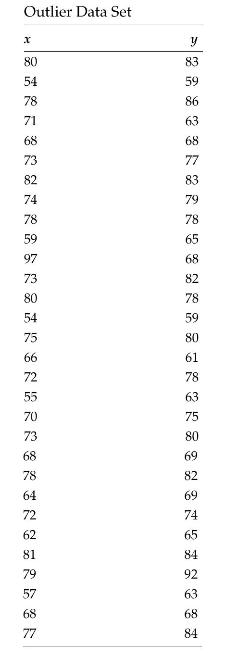
Outlier Data Set
Step by Step Solution
3.47 Rating (160 Votes )
There are 3 Steps involved in it

Get step-by-step solutions from verified subject matter experts