

Consider the variable mean amount per transaction in the Home Depot data presented here. This variable indicates,
Question:
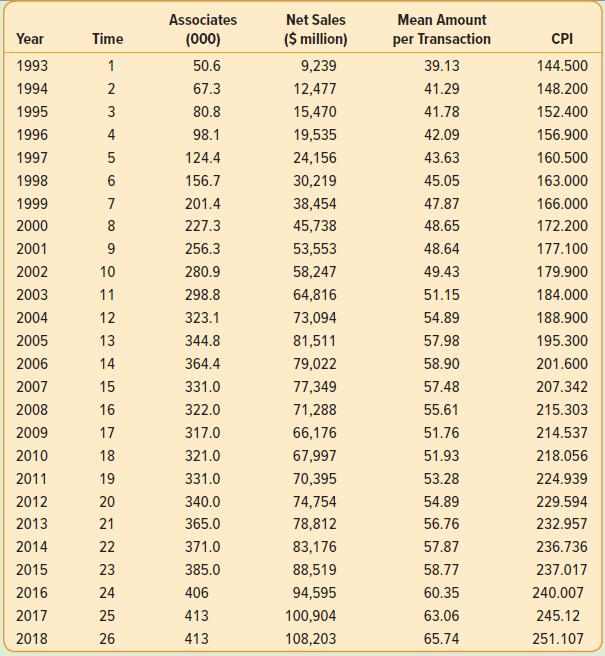
Consider the variable mean amount per transaction in the Home Depot data presented here. This variable indicates, for example, that the average customer spent $39.13 on goods during a store visit in 1993. By 2018 this amount increased to $65.74. During that same period the Consumer Price Index (CPI) as reported by the Bureau of Labor Statistics increased from 144.5 to 251.107. Convert the CPI to a 1993 base, as described on page 620 in Chapter 17 and convert the mean amount per transaction to 1993 dollars. Develop a linear trend equation for the constant 1993 dollars of the mean amount per transaction. Is it reasonable that the trend is linear? Can we conclude that the value of the amount the customer spent is less?
Step by Step Answer:
The CPI with base 1993 is constructed by dividing the CPI in each year by 1445 the CPI value in 1993 ...View the full answer


Statistical Techniques In Business And Economics
ISBN: 9781260239478
18th Edition
Authors: Douglas Lind, William Marchal, Samuel Wathen
