

Using the following time series data, respond to the following items. a. G raph the data. b.
Question:
Using the following time series data, respond to the following items.
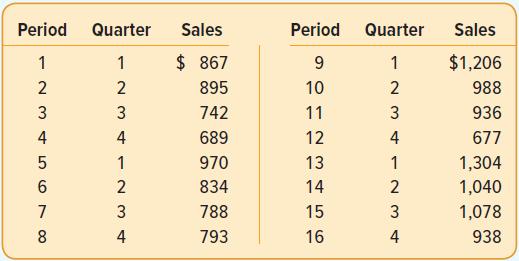
a. G raph the data.
b. Based on the graph, describe the time series pattern.
c. For this time series, why is forecasting with a seasonally adjusted trend model appropriate?
d. E valuate a seasonally adjusted trend forecasting model. What is the MAD?
e. What are the quarterly indexes?
f. Forecast sales for future periods 17 through 20.
Fantastic news! We've Found the answer you've been seeking!
Step by Step Answer:
a b The quarterly time series shows two patterns positive trend and seasonality The seasonality is indicated with quarter 4 always the lowest sales among quarters 1 2 3 and 4 in years 2 3 and 4 quarter 1 is the highest sales among quarters 1 2 3 and 4 In the first year Q1 is not the highest but close c A trend model is appropriate because we want to estimate the increasing change in sales per quarter A model with seasonal indexes is appropriate because we want to quantify the seasonal ...View the full answer

Answered By
Salmon ouma
I am a graduate of Maseno University, I graduated with a second class honors upper division in Business administration. I have assisted many students with their academic work during my years of tutoring. That has helped me build my experience as an academic writer. I am happy to tell you that many students have benefited from my work as a writer since my work is perfect, precise, and always submitted in due time. I am able to work under very minimal or no supervision at all and be able to beat deadlines.
I have high knowledge of essay writing skills. I am also well conversant with formatting styles such as Harvard, APA, MLA, and Chicago. All that combined with my knowledge in methods of data analysis such as regression analysis, hypothesis analysis, inductive approach, and deductive approach have enabled me to assist several college and university students across the world with their academic work such as essays, thesis writing, term paper, research project, and dissertation. I have managed to help students get their work done in good time due to my dedication to writing.
4+ Reviews
16+ Question Solved
Related Book For 

Statistical Techniques In Business And Economics
ISBN: 9781260239478
18th Edition
Authors: Douglas Lind, William Marchal, Samuel Wathen
Question Posted:
