

The following data report total, monthly, U.S. grocery store sales in millions ofdollars from January 2017 to
Question:
The following data report total, monthly, U.S. grocery store sales in millions ofdollars from January 2017 to December 2018. (On the site https://www.census. gov/retail/index.html#mrts, find “Monthly Retail Trade Report,” then select “Time Series/Trend Charts” to find the data for many retail sectors of the economy.)
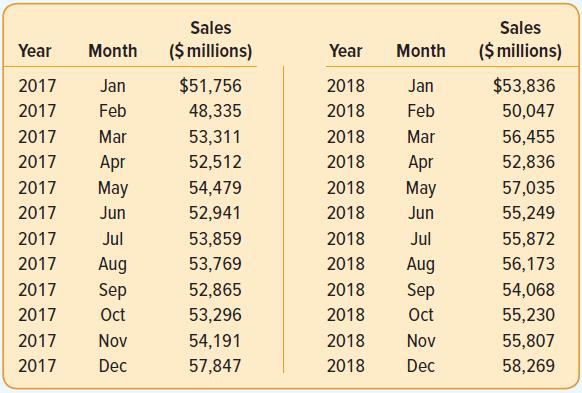
a. G raph the data.
b. Based on the graph, describe the time series pattern.
c. For this time series, why is forecasting with a seasonally adjusted trend model appropriate?
d. E valuate a seasonally adjusted trend forecasting model. What is the MAD?
e. What are the monthly indexes?
f. Forecast sales for January, February, March, and April of 2019.
Step by Step Answer:
a b The monthly time series shows two patterns positive trend and seasonality The seasonality is ...View the full answer


Statistical Techniques In Business And Economics
ISBN: 9781260239478
18th Edition
Authors: Douglas Lind, William Marchal, Samuel Wathen
