

Using the time series data in the table, respond to the following items. a. G raph the
Question:
Using the time series data in the table, respond to the following items.
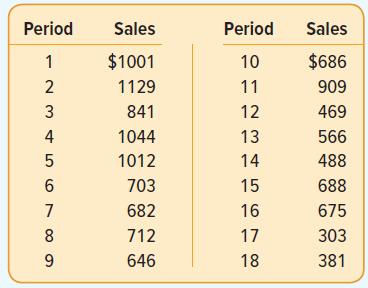
a. G raph the data.
b. Based on the graph, describe the time series pattern.
c. For this time series, why is forecasting with a trend model appropriate?
d. E valuate a trend forecasting model using simple linear regression. What is the MAD?
e. What is the predicted annual change of industry sales?
f. Predict sales for the next three periods.
Fantastic news! We've Found the answer you've been seeking!
Step by Step Answer:
a b The graph shows a negative time series trend in sales c A trend model ...View the full answer

Answered By
Ishrat Khan
Previously, I have worked as an accounting scholar at acemyhomework, and have been tutoring busines students in various subjects, mostly accounting. More specifically I'm very knowledgeable in accounting subjects for college and university level. I have done master in commerce specialising in accounting and finance as well as other business subjects.
135+ Reviews
427+ Question Solved
Related Book For 

Statistical Techniques In Business And Economics
ISBN: 9781260239478
18th Edition
Authors: Douglas Lind, William Marchal, Samuel Wathen
Question Posted:
