

Question: 1. Midterm Scores When a student performs poorly on a midterm exam, the student sometimes is convinced they will do much better on the second
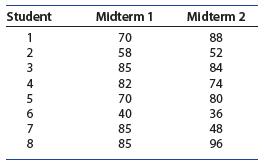
1. Midterm Scores When a student performs poorly on a midterm exam, the student sometimes is convinced they will do much better on the second midterm. The following data show the midterm scores (out of 100 points) for eight students in an introductory statistics class.
a. Construct a scatterplot for the data.
b. Describe the pattern that you see in the scatterplot.
Are there any clusters or outliers? If so, how would you explain them?
Student Midterm 1 Midterm 2 12345678 70 88 58 52 85 84 82 74 70 80 40 36 85 48 85 96
Step by Step Solution
There are 3 Steps involved in it
1 Expert Approved Answer
Step: 1 Unlock

Question Has Been Solved by an Expert!
Get step-by-step solutions from verified subject matter experts
Step: 2 Unlock
Step: 3 Unlock