

Question: 10. Property Values In Chapter 10, you compared the property evaluations of two tax assessors, A and B, as shown in the table below. a.
10. Property Values In Chapter 10, you compared the property evaluations of two tax assessors, A and B, as shown in the table below.
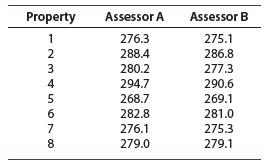
a. Use the sign test to determine whether the data present sufficient evidence to indicate that assessor A tends to give higher assessments than assessor B;
that is, P(x exceeds x ) .1/2 A B . Test by using a value of a near .05. Find the p-value for the test and interpret its value.
b. In Chapter 10, we used the t statistic to test the null hypothesis that assessor A tends to give higher assessments than assessor B, resulting in a t-value of t52.82 with p-value5.013. Do these test results agree with the results in part a? Explain why the answers are (or are not) consistent.
Property Assessor A Assessor B 1234567 276.3 275.1 288.4 286.8 280.2 277.3 294.7 290.6 268.7 269.1 282.8 281.0 276.1 275.3 8 279.0 279.1
Step by Step Solution
There are 3 Steps involved in it

Get step-by-step solutions from verified subject matter experts