

Question: 12. Refer to Exercise 11. The data in this table are the cadmium concentrations found in aphids that fed on the plants grown in soil
12. Refer to Exercise 11. The data in this table are the cadmium concentrations found in aphids that fed on the plants grown in soil amended with sludge
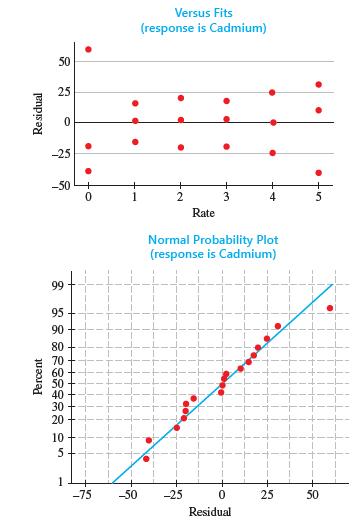
a. Use the diagnostic plots to assess whether the assumptions of normality and constant variance are reasonable in this case
b. Based on your conclusions in part
a, use an appropriate statistical method to test for significant differences in cadmium concentrations for the six rates of application
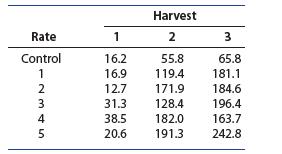
Harvest Rate 1 2 3 Control 16.2 55.8 65.8 1 16.9 119.4 181.1 3 4 2345 12.7 171.9 184.6 31.3 128.4 196.4 38.5 182.0 163.7 20.6 191.3 242.8
Step by Step Solution
There are 3 Steps involved in it

Get step-by-step solutions from verified subject matter experts