

Question: 13. Use a bar chart to describe the distribution of average daily users for the four regions in 2010. The social networking site Facebook has
13. Use a bar chart to describe the distribution of average daily users for the four regions in 2010.
The social networking site Facebook has grown rapidly in the last 10 years. The following table shows the average number of daily users (in millions)
as it has grown from 2010 to 2017 in different regions in the world
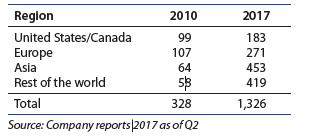
Region 2010 2017 United States/Canada 99 183 Europe 107 271 Asia 64 453 Rest of the world 5$ 419 Total 328 1,326 Source: Company reports 2017 as of Q2
Step by Step Solution
There are 3 Steps involved in it
1 Expert Approved Answer
Step: 1 Unlock

Question Has Been Solved by an Expert!
Get step-by-step solutions from verified subject matter experts
Step: 2 Unlock
Step: 3 Unlock