

Question: 14. Anscombes Quartet Anscombes quartet comprises four data sets (I IV) that have nearly identical simple descriptive statistics, yet have very different scatterplots. They
14. Anscombe’s Quartet “Anscombe’s quartet”
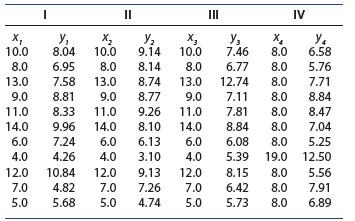
comprises four data sets (I – IV) that have nearly identical simple descriptive statistics, yet have very different scatterplots. They were constructed in 1973 by Francis Anscombe25 to emphasize the importance of graphing data prior to analysis and of the effect of outliers on the resulting analysis.
Begin by finding simple descriptive statistics for each data set including means, standard deviations, and correlations.
Next plot each of the data sets, and finally perform a simple linear regression analysis, including linear fitted line plots. Discuss your results in light of computational versus graphical results and model misspecification.
I II III IV X y X y X3 y3 X 10.0 8.04 10.0 9.14 10.0 7.46 8.0 6.58 8.0 6.95 8.0 8.14 8.0 6.77 8.0 5.76 13.0 7.58 13.0 8.74 13.0 12.74 8.0 7.71 9.0 8.81 9.0 8.77 9.0 7.11 8.0 8.84 11.0 8.33 11.0 9.26 11.0 7.81 8.0 8.47 14.0 9.96 14.0 8.10 14.0 8.84 8.0 7.04 6.0 7.24 6.0 6.13 6.0 6.08 8.0 5.25 4.0 4.26 4.0 3.10 4.0 5.39 19.0 12.50 12.0 10.84 12.0 9.13 12.0 8.15 8.0 5.56 7.0 4.82 7.0 7.26 7.0 6.42 8.0 7.91 5.0 5.68 5.0 4.74 5.0 5.73 8.0 6.89
Step by Step Solution
There are 3 Steps involved in it

Get step-by-step solutions from verified subject matter experts