

Question: 15. Fourth-Grade Test Scores A school board compared test scores on a standardized reading test for fourth-grade students in their district, selecting a random sample
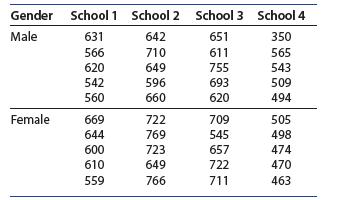
15. Fourth-Grade Test Scores A school board compared test scores on a standardized reading test for fourth-grade students in their district, selecting a random sample of five male and five female fourth-grade students at each of four different elementary schools in the district and recording the test scores. The results are shown in the table below.
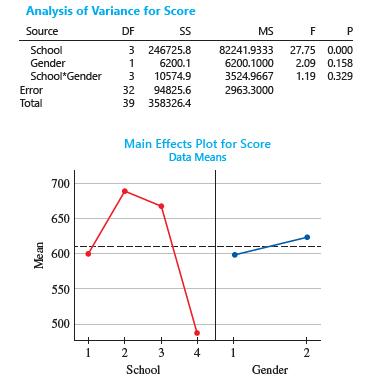
Use the MINITAB output to answer the questions that follow.
a. What type of experimental design is this? What are the experimental units? What are the factors and levels of interest to the school board?
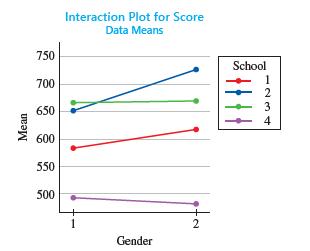
b. Do the data indicate that effect of gender on the average test score is different depending on the student’s school? Test the appropriate hypothesis using a 5.05.
c. Look at the interaction and main effects plots generated by MINITAB. How would you describe the effect of gender and school on the average test scores?
d. Do the data indicate that either of the main effects is significant? If the main effect is significant, use Tukey’s method of paired comparisons to examine the differences in detail. Use a 5.01.
Gender School 1 School 2 School 3 School 4 Male 631 642 651 350 566 710 611 565 620 649 755 543 542 596 693 509 560 660 620 494 Female 669 722 709 505 644 769 545 498 600 723 657 474 610 649 722 470 559 766 711 463
Step by Step Solution
There are 3 Steps involved in it

Get step-by-step solutions from verified subject matter experts