

Question: 16. Independent random samples are drawn from two quantitative populations, producing the sample information shown in the table. Find a 95% upper confidence bound for
16. Independent random samples are drawn from two quantitative populations, producing the sample information shown in the table. Find a 95% upper confidence bound for the difference in the two population means
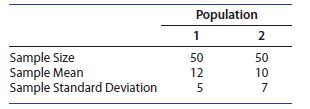
Sample Size Sample Mean Sample Standard Deviation 1 Population 50 12 525 2 10 507
Step by Step Solution
There are 3 Steps involved in it
1 Expert Approved Answer
Step: 1 Unlock

Question Has Been Solved by an Expert!
Get step-by-step solutions from verified subject matter experts
Step: 2 Unlock
Step: 3 Unlock