

Question: 2.116 Cereal sugar values Revisit the sugar data for breakfast cereals that are given in Example 4. a. Interpret the box plot in the figure
2.116 Cereal sugar values Revisit the sugar data for breakfast cereals that are given in Example 4.
a. Interpret the box plot in the figure (MINITAB output) by giving approximate values for the five-number summary.
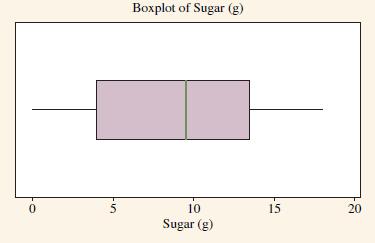
b. What does the box of the box plot suggest about possible skew?
c. The mean is 8.75 and the standard deviation is 5.32.
Find the z-score associated with the minimum sugar value of 0. Interpret.
Boxplot of Sugar (g) 0 5 10 Sugar (g) 15 20
Step by Step Solution
There are 3 Steps involved in it
1 Expert Approved Answer
Step: 1 Unlock

Question Has Been Solved by an Expert!
Get step-by-step solutions from verified subject matter experts
Step: 2 Unlock
Step: 3 Unlock