

Question: 2.12 Weather stations The pie chart (constructed using EXCEL) shown portrays the regional distribution of weather stations in the United States. a. Do the slices
2.12 Weather stations The pie chart (constructed using EXCEL) shown portrays the regional distribution of weather stations in the United States.
a. Do the slices of the pie portray (i) variables or
(ii) categories of a variable?
b. Identify what the two numbers mean that are shown for each slice of the pie.
c. Without inspecting the numbers, would it be easier to identify the modal category by using this graph or the corresponding bar graph? Why?
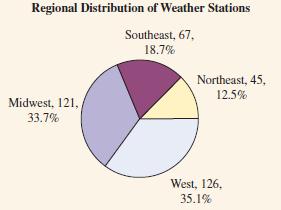
Regional Distribution of Weather Stations Southeast, 67, 18.7% Midwest, 121, 33.7% Northeast, 45, 12.5% West, 126, 35.1%
Step by Step Solution
There are 3 Steps involved in it
1 Expert Approved Answer
Step: 1 Unlock

Question Has Been Solved by an Expert!
Get step-by-step solutions from verified subject matter experts
Step: 2 Unlock
Step: 3 Unlock