

Question: 2.15 Sugar dot plot For the breakfast cereal data given in Table 2.3, a dot plot for the sugar values (in grams) is shown: a.
2.15 Sugar dot plot For the breakfast cereal data given in Table 2.3, a dot plot for the sugar values (in grams) is shown:
a. Identify the minimum and maximum sugar values.
b. Which sugar outcomes occur most frequently? What are these values called?
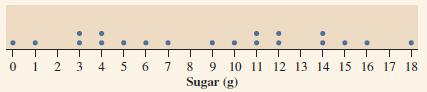
16 75 T4 0 1 2 3 4 5 6 7 8 9 10 11 12 13 14 15 16 17 18 Sugar (g)
Step by Step Solution
There are 3 Steps involved in it
1 Expert Approved Answer
Step: 1 Unlock

Question Has Been Solved by an Expert!
Get step-by-step solutions from verified subject matter experts
Step: 2 Unlock
Step: 3 Unlock