

Question: 8.39 How often read a newspaper? For the FL Student Survey data file on the books website, software reports the results for responses on the
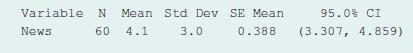
8.39 How often read a newspaper? For the FL Student Survey data file on the book’s website, software reports the results for responses on the number of times a week the subject reads a newspaper:
a. Is it plausible that m = 7, where m is the population mean for all Florida students? Explain.
b. Suppose that the sample size had been 240, with x = 4.1 and s = 3.0. Find a 95% confidence interval and compare it to the one reported. Describe the effect of sample size on the margin of error.
c. Does it seem plausible that the population distribution of this variable is normal? Why?
d. Explain the implications of the term robust regarding the normality assumption made to conduct this analysis.
Variable N Mean Std Dev SE Mean News 60 4.1 3.0 0.388 95.0 % CI (3.307, 4.859)
Step by Step Solution
There are 3 Steps involved in it

Get step-by-step solutions from verified subject matter experts