

Question: Construct a relative frequency histogram using the statistical table. How would you describe the shape of the distribution? 2. Number of Household Pets 0 1
Construct a relative frequency histogram using the statistical table. How would you describe the shape of the distribution?
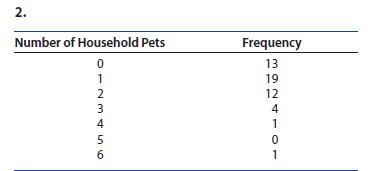
2. Number of Household Pets 0 1 Frequency 13 23456 19 12 4 1 5 0 1
Step by Step Solution
There are 3 Steps involved in it
1 Expert Approved Answer
Step: 1 Unlock

Question Has Been Solved by an Expert!
Get step-by-step solutions from verified subject matter experts
Step: 2 Unlock
Step: 3 Unlock