

Question: Crime and urbanization For the U.S. Statewide Crime data file on the books website, using MINITAB to analyze y = violent crime rate and x
Crime and urbanization For the U.S. Statewide Crime data file on the book’s website, using MINITAB to analyze y = violent crime rate and x = urbanization
(percentage of the residents living in metropolitan areas)
gives the results shown:
a. Using the five-number summary of positions, sketch a box plot for y. What does your graph and the reported mean and standard deviation of y tell you about the shape of the distribution of violent crime rate?
b. Construct a scatterplot. Does it show any potentially influential observations? Would you predict that the slope would be larger, or smaller, if you delete that observation? Why?
c. Fit the regression without the observation highlighted in part
b. Describe the effect on the slope.
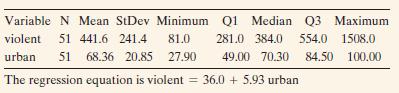
Variable N Mean StDev Minimum Q1 Median Q3 Maximum violent 51 441.6 241.4 81.0 urban 51 68.36 20.85 27.90 281.0 384.0 554.0 1508.0 49.00 70.30 84.50 100.00 The regression equation is violent = 36.0 + 5.93 urban
Step by Step Solution
There are 3 Steps involved in it

Get step-by-step solutions from verified subject matter experts