

Question: Draw a dotplot for the data set. Are the data mound-shaped? Can you use Tchebysheffs Theorem to describe the data? The Empirical Rule? Explain. 5.
Draw a dotplot for the data set. Are the data mound-shaped?
Can you use Tchebysheff’s Theorem to describe the data?
The Empirical Rule? Explain.
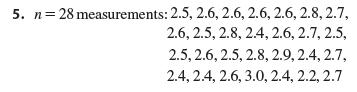
5. n 28 measurements: 2.5, 2.6, 2.6, 2.6, 2.6, 2.8, 2.7, 2.6, 2.5, 2.8, 2.4, 2.6, 2.7, 2.5, 2.5, 2.6, 2.5, 2.8, 2.9, 2.4, 2.7, 2.4, 2.4, 2.6, 3.0, 2.4, 2.2, 2.7
Step by Step Solution
There are 3 Steps involved in it
1 Expert Approved Answer
Step: 1 Unlock

Question Has Been Solved by an Expert!
Get step-by-step solutions from verified subject matter experts
Step: 2 Unlock
Step: 3 Unlock