

Question: Predicting Internet use from cell phone use We now use data from the Human Development data file on cell phone use and Internet use for
Predicting Internet use from cell phone use We now use data from the Human Development data file on cell phone use and Internet use for 39 countries.
a. The MINITAB output below shows a scatterplot.
Describe it in terms of (i) identifying the response variable and the explanatory variable, (ii) indicating whether it shows a positive or a negative association, and (iii) describing the variability of Internet use values for nations that have cellular use below 30% and for those that have cellular use above 30%.
b. Identify the approximate x- and y-coordinates for a nation that has less Internet use than you would expect, given its level of cell phone use.
c. The prediction equation is yn = 1.27
+ 0.475x.
Describe the relationship by noting how yn changes as x increases from 0 to 90, which are roughly its minimum and maximum.
d. For the United States, x = 45.1 and y = 50.15. Find its predicted Internet use and residual. Interpret the large positive residual.
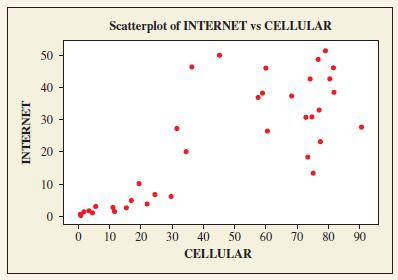
INTERNET 50 40 30 20 20 10 Scatterplot of INTERNET vs CELLULAR 0 0 10 20 30 40 50 60 70 80 90 CELLULAR
Step by Step Solution
There are 3 Steps involved in it

Get step-by-step solutions from verified subject matter experts