

Question: Table 11.6 shows the original data used to generate Table 11.5 in Example 11.12. That is, the two supervisors were each observed on three randomly
Table 11.6 shows the original data used to generate Table 11.5 in Example 11.12. That is, the two supervisors were each observed on three randomly selected days for each of the three different shifts, and the production outputs were recorded. Analyze these data using the appropriate analysis of variance procedure
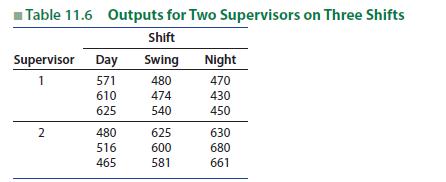
Table 11.6 Outputs for Two Supervisors on Three Shifts Shift Supervisor Day Swing Night 1 571 480 470 610 474 430 625 540 450 2 480 625 630 516 600 680 465 581 661
Step by Step Solution
There are 3 Steps involved in it
1 Expert Approved Answer
Step: 1 Unlock

Question Has Been Solved by an Expert!
Get step-by-step solutions from verified subject matter experts
Step: 2 Unlock
Step: 3 Unlock