

Question: The data points given in Exercises 7 were formed by reversing the slope of the lines in Exercises 5. Plot the points on graph paper
The data points given in Exercises 7 were formed by reversing the slope of the lines in Exercises 5. Plot the points on graph paper and calculate r and r2. Notice the change in the sign of r and the relationship between the values of r2 compared to Exercises 5.
By what percentage was the sum of squares of deviations reduced by using the least-squares predictor yˆ5a1bx rather than y as a predictor of y?
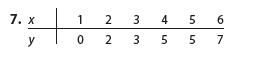
7. x 1 2 3 4 56 y 0 2 3 5 5 7
Step by Step Solution
There are 3 Steps involved in it
1 Expert Approved Answer
Step: 1 Unlock

Question Has Been Solved by an Expert!
Get step-by-step solutions from verified subject matter experts
Step: 2 Unlock
Step: 3 Unlock