

Question: The histogram and normal probability plot in Figure 7.10 were constructed based upon a sample of n550 observations from a normal population with mean m
The histogram and normal probability plot in Figure 7.10 were constructed based upon a sample of n550 observations from a normal population with mean m 510 and standard deviation s 52. Comment on the shape of the histogram and whether the normal probability plots can reasonably be described as a straight line.
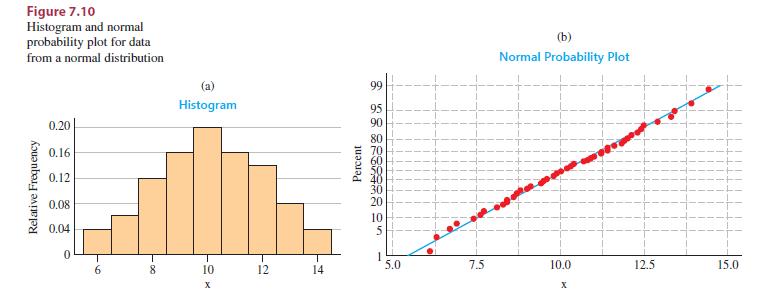
Figure 7.10 Histogram and normal probability plot for data from a normal distribution Relative Frequency 0.20 0.16 0.12 0.08 0.04 0. 99 (b) Normal Probability Plot (a) Histogram 95 90 Percent 20 10 8888885 80 70 60 6 F6 T T 1 8 10 12 14 5.0 7.5 10.0 12.5 15.0 x x
Step by Step Solution
There are 3 Steps involved in it
1 Expert Approved Answer
Step: 1 Unlock

Question Has Been Solved by an Expert!
Get step-by-step solutions from verified subject matter experts
Step: 2 Unlock
Step: 3 Unlock