

Question: Apply the sign test to the data from Exercise 8 in Chapter 7, using one of the normal approximation formulas. Explain the difference in results
Data from exercise 8 (chapter 7)
For the following set of data, assume that the X score represents the participant's performance in the experimental condition and that the Y score represents the same person's performance in the control condition. (Thus, each participant serves as his or her own control.) Compute the matched t test for these data. Also compute the 95% CI for the mean of the difference scores.
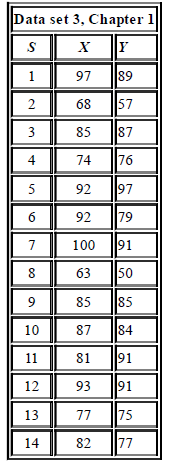
Data set 3, Chapter 1 89 97 57 68 87 85 76 4 74 97 92 92 ||79 91 100 50 63 85 85 84 10 87 91 11 81 91 12 93 75 13 77 14 82 77 2. 3. 6.
Step by Step Solution
3.38 Rating (167 Votes )
There are 3 Steps involved in it
Subtracting Y from X yields 9 positive differences 4 negatives and one tie 0 so for t... View full answer

Get step-by-step solutions from verified subject matter experts