

Question: Following are two separate (hypothetical) sets of data that are somewhat exaggerated to help clarify the procedures underlying analysis of variance. In each case, the
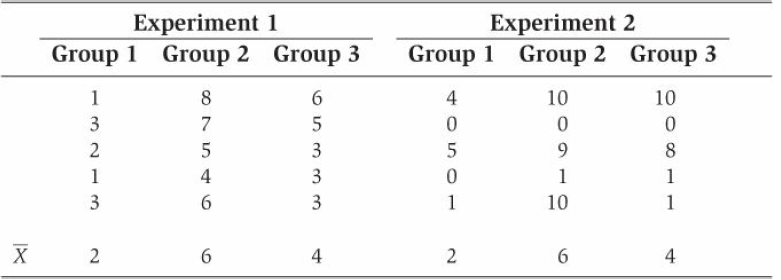
a. By inspection, in which case would you guess that the difference among groups is more likely to be statistically significant? Why?
b. Carry out the analysis of variance for Experiment 1. Are the results significant at the .05 level? Calculate eta squared.
c. Carry out the analysis of variance for Experiment 2. Are these results significant at the .05 level? Calculate eta squared.
d. Briefly describe why the F ratio and eta squared statistics differ dramatically for the two experiments even though the sample means (i.e., 2, 6, and 4) are the same in both cases.
e. Calculate an unbiased estimate of ω2 for whichever experiment is significant.
Experiment 2 Experiment 1 Group 1 Group 2 Group 3 Group 1 Group 2 Group 3 1 10 10 3 8 9. 3 3 4 3 6. 3 10 6. 4 2 4 653 mm 2.
Step by Step Solution
3.41 Rating (157 Votes )
There are 3 Steps involved in it
a There appears to be less withingroup variability in Experiment 1 and ... View full answer

Get step-by-step solutions from verified subject matter experts