

Question: The following table contains the statistics quiz scores for 18 students as a function of their phobia level and gender. a. Compute the two-way ANOVA
The following table contains the statistics quiz scores for 18 students as a function of their phobia level and gender.
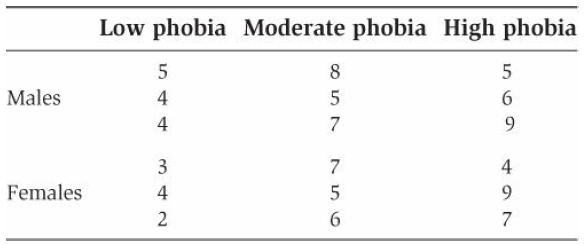
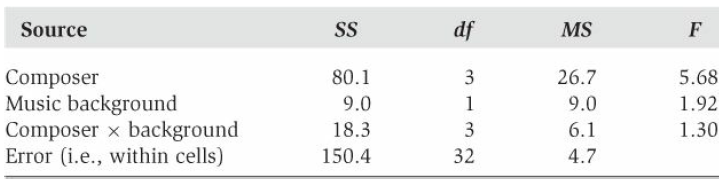
a. Compute the two-way ANOVA for these data, and present your results in the form of an ANOVA summary table (see Table 14.2).
b. Conduct the appropriate follow-up tests to determine which phobic levels differ significantly from other levels. Are these follow-up tests justified by your results in part (a)? Explain.
Table 14.2
Low phobia Moderate phobia High phobia Males 4 6. 4 9. 3 4 Females 9. 6. Source SS df MS Composer Music background Composer x background 80.1 5.68 1.92 3 26.7 9.0 9.0 18.3 3 32 6.1 1.30 Error (i.e., within cells) 150.4 4.7
Step by Step Solution
3.63 Rating (161 Votes )
There are 3 Steps involved in it
a Source SS df MS F p Phobia 3244 2 1622 634 05 Gender 200 1 200 78 05 Inter... View full answer

Get step-by-step solutions from verified subject matter experts