

Question: What pattern analysis rules are violated in the control chart in Figure 17-12? Note that for the in-control process, the mean = 3 and the
What pattern analysis rules are violated in the control chart in Figure 17-12?
Note that for the in-control process, the mean = 3 and the standard deviation = 0.5, so the centerline is at 3.0, the 3-sigma limits at 1.5 and 4.5, the 2-sigma limits are at 4.0 and 2.0, and the 1-sigma limits are at 3.5 and 2.5.
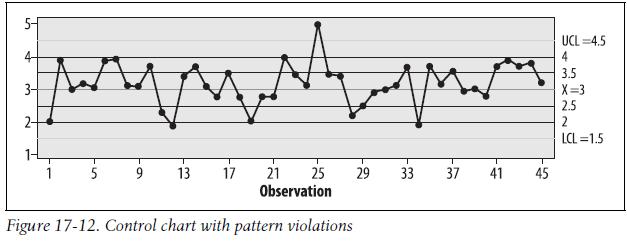
UCL 4.5 4- 3- www.m M 4 3.5 X=3 2.5 2 LCL=1.5 T T T 5 9 13 17 21 25 29 33 37 41 45 Observation Figure 17-12. Control chart with pattern violations
Step by Step Solution
There are 3 Steps involved in it
1 Expert Approved Answer
Step: 1 Unlock

Question Has Been Solved by an Expert!
Get step-by-step solutions from verified subject matter experts
Step: 2 Unlock
Step: 3 Unlock