

Calculate the rank correlation coefficient between price and quantity for the data in Problem 7.2. How does
Question:
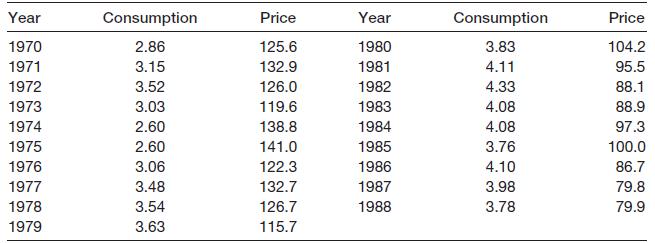
Calculate the rank correlation coefficient between price and quantity for the data in Problem 7.2. How does it compare with the ordinary correlation coefficient?
Problem 7.2
The data below show consumption of margarine (in ounces per person per week) and its real price, for the UK.
Fantastic news! We've Found the answer you've been seeking!
Step by Step Answer:
ANSWER To calculate the rank correlation coefficient we first need to rank the data for both consumption and price Year Consumption Rank Price Rank 19...View the full answer

Answered By
Aketch Cindy Sunday
I am a certified tutor with over two years of experience tutoring . I have a passion for helping students learn and grow, and I firmly believe that every student has the potential to be successful. I have a wide range of experience working with students of all ages and abilities, and I am confident that I can help students succeed in school.
I have experience working with students who have a wide range of abilities. I have also worked with gifted and talented students, and I am familiar with a variety of enrichment and acceleration strategies.
I am a patient and supportive tutor who is dedicated to helping my students reach their full potential. Thank you for your time and consideration.
0 Reviews
10+ Question Solved
Related Book For 
Statistics For Economics Accounting And Business Studies
ISBN: 978027368308
4th Edition
Authors: Michael Barrow
Question Posted:
