All Matches
Solution Library
Expert Answer
Textbooks
Search Textbook questions, tutors and Books
Oops, something went wrong!
Change your search query and then try again
Toggle navigation
FREE Trial
S
Books
FREE
Tutors
Study Help
Expert Questions
Accounting
General Management
Mathematics
Finance
Organizational Behaviour
Law
Physics
Operating System
Management Leadership
Sociology
Programming
Marketing
Database
Computer Network
Economics
Textbooks Solutions
Accounting
Managerial Accounting
Management Leadership
Cost Accounting
Statistics
Business Law
Corporate Finance
Finance
Economics
Auditing
Hire a Tutor
AI Tutor
New
Search
Search
Sign In
Register
study help
mathematics
statistics economics accounting
Questions and Answers of
Statistics Economics Accounting
The World Development Report contains data on the income distributions of many countries around the world (by quintile). Use these data to compare income distributions across countries, focusing
Compare the degrees of concentration in the following two industries. Can you say which is likely to be more competitive? D E 769 Firm A B F G H Sales 337 384 696 321 265 358 521 880 334 Sales 556
Calculate the three-firm concentration ratio for employment in the following industry: Firm A B D E F G H Employees 3350 290 440 1345 821 112 244 352
For the Kravis, Heston and Summers data (Table 10.26), combine the deciles into quintiles and calculate the Gini coefficient from the quintile data. How does your answer compare with the answer given
The following table shows the income distribution by quintile for the UK in 1991, for various definitions of income:(a) Use equation (10.27) to calculate the Gini coefficient for each of the four
(a) Draw a Lorenz curve and calculate the Gini coefficient for the 1979 wealth data contained in Problem 1.5 (Chapter 1). Draw the Lorenz curve on the same diagram as you used in Problem 10.17.(b)
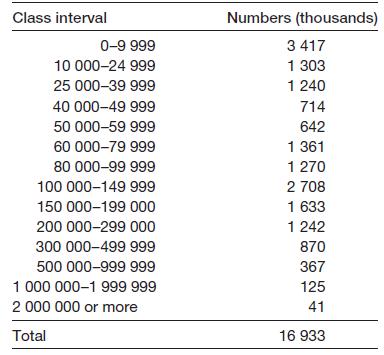
(a) Draw a Lorenz curve and calculate the Gini coefficient for the wealth data in Chapter 1 (Table 1.3).(b) Why is the Gini coefficient typically larger for wealth distributions than for income
Calculate the internal rates of return for the projects in Problem 10.14.Problem 10.14A firm uses a discount rate of 12% for all its investment projects. Faced with the following choice of projects,
Calculate the internal rate of return for the project in Problem 10.13. Use either trial and error methods or a computer to solve.Problem 10.13A firm is investing in a project and wishes to receive a
A firm uses a discount rate of 12% for all its investment projects. Faced with the following choice of projects, which yields the higher NPV? Project Outlay Income stream 1 3 4 6 A 5600 1000 1400
A firm is investing in a project and wishes to receive a rate of return of at least 15% on it. The stream of net income is:(a) What is the present value of this income stream?(b) If the investment
(a) If w represents the wage rate and p the price level, what is w/p?(b) If Δw represents the annual growth in wages and i is the inflation rate, what is Δw − i?(c) What does ln(w) − ln(p)
The following data show expenditure on the National Health Service (in cash terms), the GDP deflator, the NHS pay and prices index, population, and population of working age:(In all the following
Using the data in Problem 10.6 above, calculate how much the average consumer would need to be compensated for the rise in prices between 1990 and 1994.Problem 10.6The following table shows the
Industry is complaining about the rising price of energy. It demands to be compensated for any rise over 2% in energy prices between 1999 and 2000. How much would this compensation cost? Which price
Construct a chain index for 1995–2004 using the following data, setting 1998 = 100. 1995 1996 1997 1998 1999 2000 2001 2002 2003 2004 87 95 100 105 98 93 100 104 110 100 106 112
Construct a chain index from the following data series:What problems arise in devising such an index and how do you deal with them? 1998 1999 2000 2001 2002 2003 2004 Series 1 100 110 115 122 125
The following table shows the weights in the retail price index and the values of the index itself, for 1990 and 1994.(a) Calculate the Laspeyres price index for 1994, based on 1990 = 100.(b) Draw a
(a) Using the data in Problem 10.3, calculate the expenditure shares on each fuel in 1984 and the individual price index number series for each fuel, with 1984 = 100.(b) Use these data to construct
The prices of different house types in south-east England are given in the table below:(a) If the numbers of each type of house in 1991 were 1898, 1600, 1601, 499 and 1702 respectively, calculate the
The following data show energy prices and consumption in 1984–88 (analogous to the data in the chapter for the years 1999–2003).(a) Construct a Laspeyres price index using 1984 as the base
The following data show the gross trading profits of companies, 1987–92, in the UK, in £m.(a) Turn the data into an index number series with 1987 as the reference year.(b) Transform the series so
The data below show exports and imports for the UK, 1987–92, in £bn at current prices.(a) Construct index number series for exports and imports, setting the index equal to 100 in 1987 in each
Do a survey to find the average age of cars parked on your college campus. (A letter or digit denoting the registration year can be found on the number plate – precise details can be obtained in
Visit your college library to collect data to answer the following question. Has females’ remuneration risen relative to men’s over the past ten years? You should write a short report on your
A firm has £10 000 to spend on a survey. It wishes to know the average expenditure on gas by businesses to within £30 with 99% confidence. The variance of expenditure is believed to be about 40
A firm wishes to know the average weekly expenditure on food by households to within £2, with 95% confidence. If the variance of food expenditure is thought to be about 400, what sample size does
Find figures for the monetary aggregate M0 for the years 1995–2003 in the UK, in nominal terms.
Find the gross domestic product for both the UK and the US for the period 1995–2003. Obtain both series in constant prices.
What issues of definition arise in trying to measure ‘unemployment’?
What issues of definition arise in trying to measure ‘output’?
Build a suitable model to predict car sales in the UK. You should use time-series data (at least 20 annual observations). You should write a report in a similar manner to Problem 7.12.Problem 7.12Try
In a cross-section study of the determinants of economic growth (National Bureau of Economic Research, Macroeconomic Annual, 1991), Stanley Fischer obtained the following regression equation:whereGY:
R. Dornbusch and S. Fischer (in R.E. Caves and L.B. Krause, Britain’s Economic Performance, Brookings, 1980) report the following equation for predicting the UK balance of payments: whereB:
As Problem 8.9, for(a) Investment,(b) The pattern of UK exports (i.e. which countries they go to),(c) Attendance at football matches.Problem 8.9How would you estimate a model explaining the following
How would you estimate a model explaining the following variables?(a) Airline efficiency,(b) Infant mortality,(c) Bank profits.You should consider such issues as whether to use time-series or cross
As Problem 8.7, for(a) Measurement of economies of scale in the production of books,(b) The determinants of cinema attendances,(c) The determinants of the consumption of perfume.Problem 8.7Would it
Would it be better to use time-series or cross-section data in the following models?(a) The relationship between the exchange rate and the money supply,(b) The determinants of divorce,(c) The
As Problem 8.5, for(a) The output of a car firm, in a production function equation,(b) Potential trade union influence in wage bargaining,(c) The performance of a school.Problem 8.5How would you most
How would you most appropriately measure the following variables:(a) Social class in a model of alcohol consumption,(b) Crime,(c) Central bank independence from political interference.
Given the following data for 1989 and 1990:(a) Predict the levels of margarine consumption in the two years.(b) The actual values of consumption for the two years were 3.47 and 3.19. How accurate are
Using the results from Problem 8.1 forecast the birth rate of a country with the characteristics given in Problem 7.9 (see page 254) (point estimate only).Problem 7.9From your results for the birth
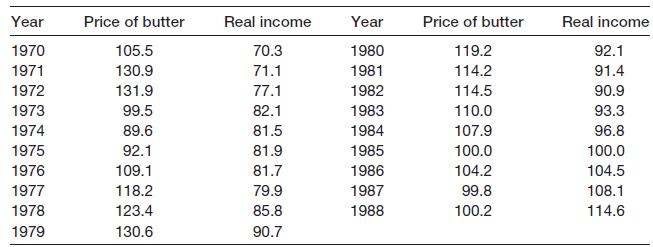
The following data show the real price of butter and real incomes, to supplement the data in Problem 7.2.(a) Estimate a multiple regression model of the demand for margarine. Do the coefficients have
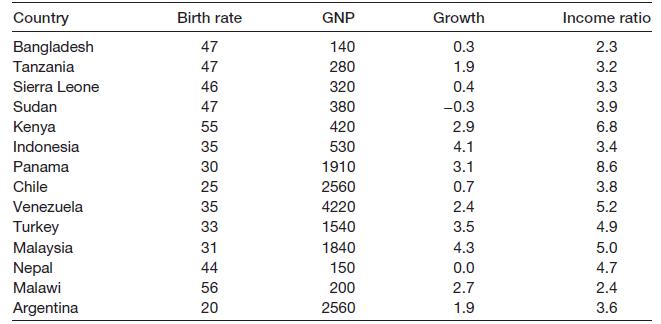
(a) Using the data in Problem 7.1 (page 253), estimate a multiple regression model of the birth rate explained by GNP, the growth rate and the income ratio. Comment upon:(i) the sizes and signs of
Try to build a model of the determinants of infant mortality. You should use cross-section data for 20 countries or more and should include both developing and developed countries in the sample.Write
Update Todaro’s study using more recent data.
Predict margarine consumption given a price of 70. Use the 99% confidence level.
From your results for the birth rate model, predict the birth rate for a country with either(a) GNP equal to $3000,(b) A growth rate of 3% p.a., (c) An income ratio of 7. How does your
(a) For the data given in Problem 7.2, estimate the sample regression line and calculate the R2 statistic. Comment upon the results.(b) Calculate the standard error of the estimate and the standard
(a) For the data in Problem 7.1, find the estimated regression line and calculate the R2 statistic. Comment upon the result. How does it compare with Todaro’s findings? (b) Calculate the
Calculate the rank correlation coefficient between price and quantity for the data in Problem 7.2. How does it compare with the ordinary correlation coefficient?Problem 7.2The data below show
Using the data from Problem 7.1, calculate the rank correlation coefficient between the variables and test its significance. How does it compare with the ordinary correlation coefficient?Problem
As Problem 7.3, for(a) Real consumption and real income;(b) Individuals’ alcohol and cigarette consumption;(c) UK and US interest rates.Problem 7.3What would you expect to be the correlation
What would you expect to be the correlation coefficient between the following variables? Should the variables be measured contemporaneously or might there be a lag in the effect of one upon the
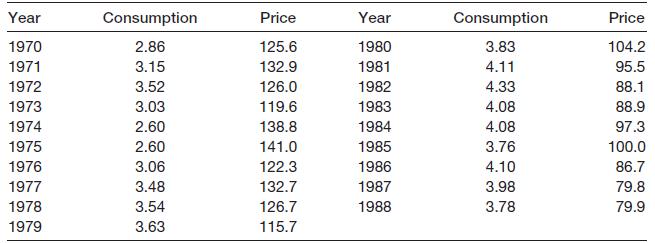
The data below show consumption of margarine (in ounces per person per week) and its real price, for the UK.(a) Draw an XY plot of the data and comment.(b) From the chart, would you expect the line
The other data which Todaro might have used to analyse the birth rate were: For one of the three possible explanatory variables (in class, different groups could examine each of the
Use your spreadsheet or other computer program to generate 100 random integers in the range 0 to 9. Draw up a frequency table and use a χ2 test to examine whether there is any bias towards any
Conduct a survey among fellow students to examine whether there is any association between:(a) Gender and political preference, or(b) Subject studied and political preference, or(c) Star sign and
Lottery tickets are sold in different outlets: supermarkets, smaller shops and outdoor kiosks. Sales were sampled from several of each of these, with the following results:Does the evidence indicate
Groups of children from four different classes in a school were randomly selected and sat a test, with the following test scores:(a) Test whether there is any difference between the classes, using
An example in Chapter 4 compared R&D expenditure in Britain and Germany. The sample data were:x̅1 = 3.7 x̅2 = 4.2s1 = 0.6 s2 = 0.9n1 = 20 n2 = 15Is there evidence, at the 5%
Given the following data on two sample variances, test whether there is any significant difference. Use the 1% significance level.s21 = 55 s22 = 48n1 = 25 n2 = 30
A roadside survey of the roadworthiness of vehicles obtained the following results:Is there any association between the type of vehicle and the likelihood of it being unfit for the road? Roadworthy
(a) Do the accountants’ job properly for them (see the Oops! box in the text (page 203) ).(b) It might be justifiable to omit the ‘no responses’ entirely from the calculation. What happens if
The following data show the percentages of firms using computers in different aspects of their business:Is there an association between the size of firm and its use of computers? Firm size Computers
A survey of 100 firms found the following evidence regarding profitability and market share:Is there evidence that market share and profitability are associated? Profitability Market share 30% Low 18
A company wishes to see whether there are any differences between its departments in staff turnover. Looking at their records for the past year the company finds the following data:Do the data
Four different holiday firms which all carried equal numbers of holidaymakers reported the following numbers who expressed satisfaction with their holiday:Is there any significant difference between
A survey of 64 families with five children found the following gender distribution:Test whether the distribution can be adequately modelled by the Binomial distribution. Number of boys 1 3 4 Number
Use the data in Table 6.3 to see if there is a significant difference between road casualties in quarters I and III on the one hand and quarters II and IV on the other.Table 6.3 Quarter II II IV
Using the data n = 70, s = 15, construct a 99% confidence interval for the true standard deviation.
A sample of 40 observations has a standard deviation of 20. Estimate the 95% confidence interval for the standard deviation of the population.
Use the = RAND( ) function in your spreadsheet to create 100 samples of size 25 (which are effectively all from the same population). Compute the mean and standard deviation of each sample. Calculate
Can your class tell the difference between tap water and bottled water? Set up an experiment as follows: fill r glasses with tap water and n − r glasses with bottled water. The subject has to guess
Discuss in general terms how you might ‘test’ the following:(a) Astrology,(b) Extra-sensory perception,(c) The proposition that company takeovers increase profits.
Another group of workers were tested at the same times as those in Problem 5.23, although their department also introduced rest breaks into the working day.Does the introduction of rest days alone
The output of a group of 11 workers before and after an improvement in the lighting in their factory is as follows:Test whether there is a significant improvement in performance(a) Assuming these are
(a) A consumer organisation is testing two different brands of battery. A sample of 15 of brand A shows an average useful life of 410 hours with a standard deviation of 20 hours. For brand B, a
Two samples are drawn. The first has a mean of 150, variance 50 and sample size 12. The second has mean 130, variance 30 and sample size 15. Test the hypothesis that they are drawn from populations
A photo processing company sets a quality standard of no more than 10 complaints per week on average. A random sample of 8 weeks showed an average of 13.6 complaints, with standard deviation 5.3. Is
(a) A random sample of 20 observations yielded a mean of 40 and standard deviation 10. Test the hypothesis that μ = 45 against the alternative that it is not. Use the 5% significance level.(b) What
(a) A pharmaceutical company testing a new type of pain reliever administered the drug to 30 volunteers experiencing pain. Sixteen of them said that it eased their pain. Does this evidence support
A random sample of 180 men who took the driving test found that 103 passed. A similar sample of 225 women found that 105 passed. Test whether pass rates are the same for men and women.
A transport company wants to compare the fuel efficiencies of the two types of lorry it operates. It obtains data from samples of the two types of lorry, with the following results:Test the
Given the following data from two independent samples:x̅1 = 115 x̅2 = 105s1 = 21 s2 = 23n1 = 49 n2 = 63test the hypothesis of no difference between the population means against the alternative that
Test the hypothesis that 10% of your class or lecture group are left-handed.
Test H0: π = 0.5 against H0: π ≠ 0.5 using p = 0.45 from a sample of size n = 35.
From experience it is known that a certain brand of tyre lasts, on average, 15 000 miles with standard deviation 1250. A new compound is tried and a sample of 120 tyres yields an average life of 15
Given the following sample data:x̅ = 15 s2 = 270 n = 30test the null hypothesis that the true mean is equal to 12, against a two-sided alternative hypothesis. Draw the distribution of e
Given the two hypothesesH0: μ = 400H1: μ = 415and σ2 = 1000 (for both hypotheses):(a) Draw the distribution of e under both hypotheses.(b) If the decision rule is chosen to be: reject H0 if e ≥
What is the power of the test carried out in Problem 3?Problem 3A coin which is either fair or has two heads is to be tossed twice. You decide on the following decision rule: if two heads occur you
Given the sample data e = 45, s = 16, n = 50, at what level of confidence can you reject H0: μ = 40 against a two-sided alternative?
Testing the null hypothesis that μ = 10 against μ > 10, a researcher obtains a sample mean of 12 with standard deviation 6 from a sample of 30 observations. Calculate the z score and the
Computer diskettes which do not meet the quality required for high density (1.44 Mb) diskettes are sold as double-density diskettes (720 kb) for 80 pence each. Highdensity diskettes are sold for
A firm receives components from a supplier, which it uses in its own production. The components are delivered in batches of 2000. The supplier claims that there are only 1% defective components on
In comparing two medical treatments for a disease, the null hypothesis is that the two treatments are equally effective. Why does making a Type I error not matter? What significance level for the
A coin which is either fair or has two heads is to be tossed twice. You decide on the following decision rule: if two heads occur you will conclude it is a two-headed coin, otherwise you will presume
Consider the investor in the text, seeking out companies with weekly turnover of at least £5000. He applies a one-tail hypothesis test to each firm, using the 5% significance level. State whether
Answer true or false, with reasons if necessary.(a) There is no way of reducing the probability of a Type I error without simultaneously increasing the probability of a Type II error.(b) The
Estimate the average weekly expenditure upon alcohol by students. Ask a (reasonably) random sample of your fellow students for their weekly expenditure on alcohol. From this, calculate the 95%
Showing 1 - 100
of 197
1
2