

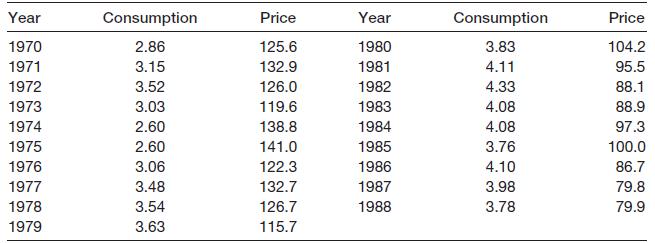
The data below show consumption of margarine (in ounces per person per week) and its real price,
Question:
The data below show consumption of margarine (in ounces per person per week) and its real price, for the UK.
(a) Draw an XY plot of the data and comment.
(b) From the chart, would you expect the line of best fit to slope up or down? In theory, which way should it slope?
(c) What would you expect the correlation coefficient to be, approximately?
(d) Calculate the correlation coefficient between margarine consumption and its price.
(e) Is the coefficient significantly different from zero? What is the implication of the result?
(The following totals will reduce the burden of calculation: ΣY = 67.52; ΣX = 2101.70; ΣY2 = 245.055; ΣX2 = 240 149.27; ΣXY = 7299.638; Y is consumption, X is price. If you wish, you could calculate a logarithmic correlation. The relevant totals are: Σy = 23.88; Σx = 89.09; Σy2 = 30.45; Σx2 = 418.40; Σxy = 111.50, where y = lnY and x = lnX.)
Step by Step Answer:
a Here is the XY plot of the data Here is the plot of the data in text format 45 40 35 30 25 20 1970 ...View the full answer


Statistics For Economics Accounting And Business Studies
ISBN: 978027368308
4th Edition
Authors: Michael Barrow
