

The following table shows the weights in the retail price index and the values of the index
Question:
The following table shows the weights in the retail price index and the values of the index itself, for 1990 and 1994.
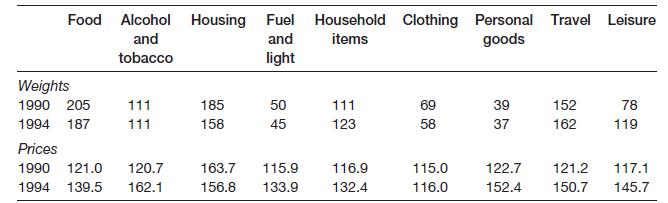
(a) Calculate the Laspeyres price index for 1994, based on 1990 = 100.
(b) Draw a bar chart of the expenditure weights in 1990 and 1994 to show how spending patterns have changed. What major changes have occurred? Do individuals seem to be responding to changes in relative prices?
(c) The pensioner price index is similar to the general index calculated above, except that it excludes housing. What effect does this have on the index? What do you think is the justification for this omission?
(d) If consumers spent, on average, £188 per week in 1990 and £240 per week in 1994, calculate the real change in expenditure on food.
(e) Do consumers appear rational, i.e. do they respond as one would expect to relative price changes? If not, why not?
Step by Step Answer:

This question has not been answered yet.
You can Ask your question!

Statistics For Economics Accounting And Business Studies
ISBN: 978027368308
4th Edition
Authors: Michael Barrow
