

Question: Using the data from Problem 1.5: (a) Calculate the mean, median and mode of the distribution. Why do they differ? (b) Calculate the inter-quartile range,
Using the data from Problem 1.5:
(a) Calculate the mean, median and mode of the distribution. Why do they differ?
(b) Calculate the inter-quartile range, variance, standard deviation and coefficient of variation of the data.
(c) Calculate the skewness of the distribution.
(d) From what you have calculated, and the data in the chapter, can you draw any conclusions about the degree of inequality in wealth holdings, and how this has changed?
(e) What would be the effect upon the mean of assuming the final class width to be £10m? What would be the effects upon the median and mode?
Problem 1.5
The distribution of marketable wealth in 1979 in the UK is shown in the table below (taken from Inland Revenue Statistics 1981, p. 105):
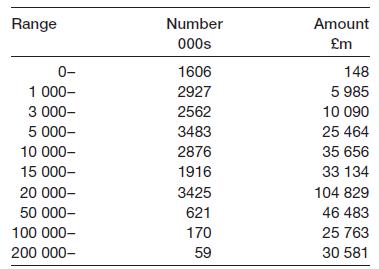
Range Number Amount 000s m 0- 1606 148 1 000- 2927 5 985 3 000- 2562 10 090 5 000- 3483 25 464 10 000- 2876 35 656 15 000- 1916 33 134 20 000- 3425 104 829 50 000- 621 46 483 100 000- 170 25 763 200 000- 59 30 581
Step by Step Solution
3.34 Rating (154 Votes )
There are 3 Steps involved in it
a The mean of the distribution can be calculated by adding up all the values and dividing by the total number of observations mean 0501 1512 2523 4545 85810 2252025 3753040 6255075 1125100150100 4341 ... View full answer

Get step-by-step solutions from verified subject matter experts