

Question: A quality-control apprentice is preparing a CUSUM chart. The values calculated for SL and SH are presented in the following table. Three of the values
A quality-control apprentice is preparing a CUSUM chart. The values calculated for SL and SH are presented in the following table. Three of the values have been calculated incorrectly. Which are they?
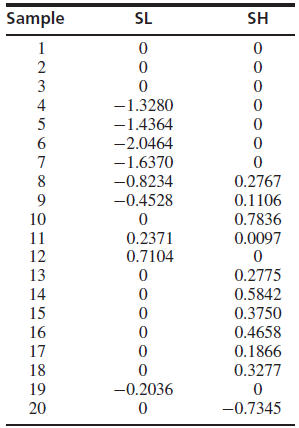
Sample SL SH 1 2 3 4 -1.3280 5 -1.4364 6. -2.0464 7 -1.6370 8 -0.8234 0.2767 9 -0.4528 0.1106 10 0.7836 11 12 0.2371 0.7104 0.0097 13 0.2775 14 0.5842 15 0.3750 16 0.4658 17 0.1866 18 0.3277 19 -0.2036 20 -0.7345
Step by Step Solution
★★★★★
3.48 Rating (161 Votes )
There are 3 Steps involved in it
1 Expert Approved Answer
Step: 1 Unlock

The value of SL can never be posit... View full answer
Question Has Been Solved by an Expert!
Get step-by-step solutions from verified subject matter experts
Step: 2 Unlock
Step: 3 Unlock