

Question: Another chemical engineer is studying the same process as in Exercise 7, and uses the following experimental matrix. a. Compute the correlation between temperature and
a. Compute the correlation between temperature and yield, between stirring rate and yield, and between temperature and stirring rate.
b. Do these data provide good evidence that the yield is unaffected by temperature, within the range of the data? Or might the result be due to confounding? Explain.
c. Do these data provide good evidence that increasing the stirring rate causes the yield to increase, within the range of the data? Or might the result be due to confounding? Explain.
d. Which experimental design is better, this one or the one in Exercise 7? Explain.
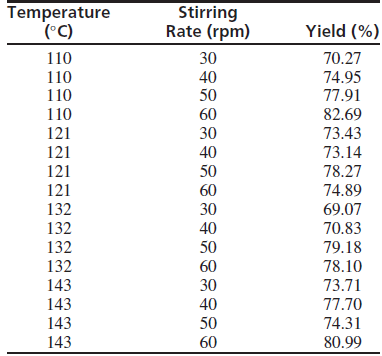
Temperature (C) Stirring Rate (rpm) Yield (%) 110 30 70.27 40 50 110 110 110 121 74.95 77.91 60 82.69 30 73.43 121 40 73.14 50 60 78.27 121 121 74.89 132 30 69.07 132 40 70.83 132 79.18 50 132 60 78.10 143 30 73.71 143 40 77.70 143 50 74.31 143 60 80.99
Step by Step Solution
3.41 Rating (157 Votes )
There are 3 Steps involved in it
a Let x represent temperature y represent stirring rate and z represent yield ... View full answer

Get step-by-step solutions from verified subject matter experts