

Question: Structural engineers use wireless sensor networks to monitor the condition of dams and bridges. The article Statistical Analysis of Vibration Modes of a Suspension Bridge
a. Construct a scatterplot of frequency (y) versus damping ratio (x). Verify that a linear model is appropriate.
b. Compute the least-squares line for predicting frequency from damping ratio.
c. If two modes differ in damping ratio by 0.2, by how much would you predict their frequencies to differ?
d. Predict the frequency for modes with damping ratio 0.75.
e. Should the equation be used to predict the frequency for modes that are overdamped (damping ratio > 1)? Explain why or why not.
f. For what damping ratio would you predict a frequency of 2.0?
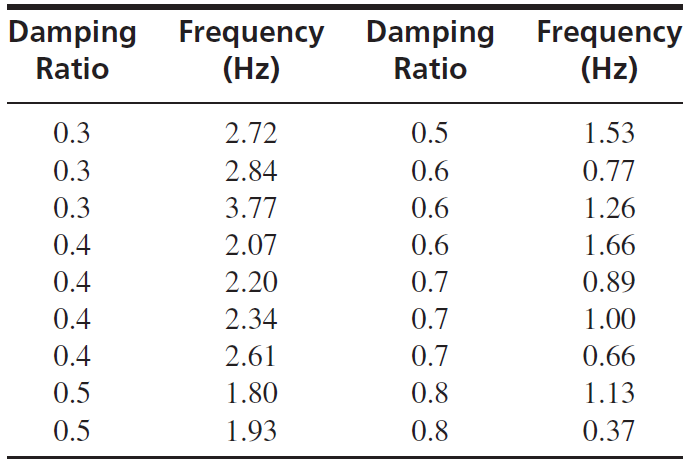
Damping Frequency Damping Frequency (Hz) (Hz) Ratio Ratio 1.53 2.72 0.3 0.5 0.3 2.84 0.6 0.77 0.3 1.26 3.77 0.6 0.4 2.07 0.6 1.66 0.4 2.20 0.7 0.89 0.4 2.34 0.7 1.00 0.7 0.4 2.61 0.66 0.8 0.5 1.80 1.13 0.5 1.93 0.8 0.37
Step by Step Solution
3.35 Rating (164 Votes )
There are 3 Steps involved in it
a b The equation of the leastsquares line is y 4341599 4905134x c ... View full answer

Get step-by-step solutions from verified subject matter experts