

Question: In the article referred to in Exercise 2, a model was fit to investigate the relationship between the independent variables given in Exercise 2 and
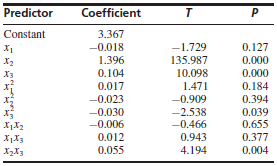
In the article referred to in Exercise 2, a model was fit to investigate the relationship between the independent variables given in Exercise 2 and the amount of S-isomer collected. The results of a least-squares fit are presented in the following table. (The article did not provide the value of the t statistic for the constant term.)
Of the following, which is the best next step in the analysis? Explain your reasoning.
i. Drop x21 , x22 , and x23 from the model, and then perform an F test.
ii. Nothing needs to be done. This model is fine.
iii. Add cubic terms x31 , x32 , and x33 to the model to try to improve the fit.
iv. Drop x1x2, x1x3, and x2x3 from the model, and then perform an F test.
v. Drop x22 , x1x2, and x1x3 from the model, and then perform an F test.
Predictor Coefficient P Constant 3.367 -0.018 -1.729 0.127 X2 1.396 135.987 0.000 0.104 10.098 0.000 0.017 1.471 0.184 -0.023 -0.909 0.394 -0.030 -0.006 -2.538 -0.466 0.039 0.655 X1X3 0.012 0.943 0.377 0.055 4.194 0.004
Step by Step Solution
3.43 Rating (172 Votes )
There are 3 Steps involved in it
v x 2 2 x 1 x 2 and x ... View full answer

Get step-by-step solutions from verified subject matter experts