

Question: The article Simultaneous Optimization of Mechanical Properties of Steel by Maximizing Exponential Desirability Functions (K. J. Kim and D. K. J. Lin, Journal of the
Of the following, which is the best next step in the analysis? Explain your reasoning.
i. Add interaction terms Carbon · Manganese and Manganese · Silicon to try to find more variables to put into the model.
ii. Add the interaction term Carbon · Silicon to try to find another variable to put into the model.
iii. Nothing needs to be done. This model is fine.
iv. Drop Carbon and Silicon, and then perform an F test.
v. Drop Manganese, and then perform an F test.
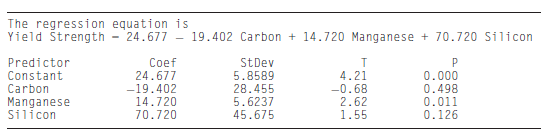
The regression equation is Yield Strength - 24.677 19.402 Carbon + 14.720 Manganese + 70.720 Silicon Predictor StDev 5.8589 28.455 5.6237 45.675 Coef 24.677 -19.402 14.720 70.720 4.21 -0.68 2.62 0.000 0.498 Constant Carbon Manganese Silicon 0.011 0.126 1.55
Step by Step Solution
3.45 Rating (171 Votes )
There are 3 Steps involved in it
iv Carbon and Silic... View full answer

Get step-by-step solutions from verified subject matter experts