

Question: Refer to Table 1.4 (in Section 1.3). TABLE 1.4 a. Using the class intervals in the table, construct a histogram in which the heights of
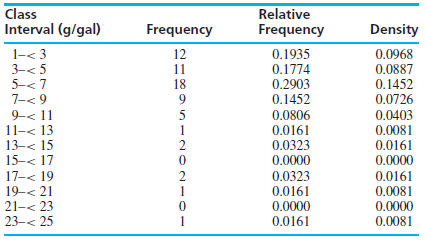
TABLE 1.4
a. Using the class intervals in the table, construct a histogram in which the heights of the rectangles are equal to the frequencies.
b. Using the class intervals in the table, construct a histogram in which the heights of the rectangles are equal to the densities.
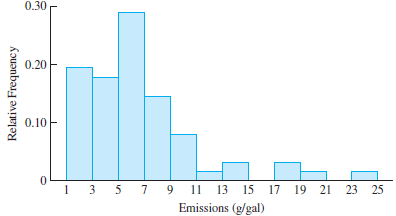
c. Compare the histograms in parts (a) and (b) with the histogram in Figure 1.8, for which the heights are the relative frequencies. Are the shapes of the histograms the same?
Class Interval (g/gal) Relative Frequency Frequency Density 1- < 3 3- < 5 5-
Step by Step Solution
3.36 Rating (168 Votes )
There are 3 Steps involved in it
a b c Yes the shapes of t... View full answer

Get step-by-step solutions from verified subject matter experts