

Question: Refer to Table 1.5 (in Section 1.3). a. Using the class intervals in the table, construct a histogram in which the heights of the rectangles
a. Using the class intervals in the table, construct a histogram in which the heights of the rectangles are equal to the relative frequencies.
b. Compare the histogram in part (a) with the histogram in Figure 1.9, for which the heights are the densities. Are the shapes of the histograms the same?
c. Explain why the heights should not be set equal to the relative frequencies in this case.
d. Which classes are visually exaggerated by making the heights equal to the relative frequencies?
TABLE 1.5
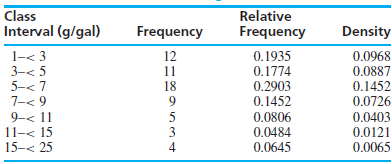
Class Interval (g/gal) Relative Frequency Frequency Density 1- < 3 12 11 18 0.1935 0.1774 0.2903 0.1452 0.0968 0.0887 0.1452 0.0726 3- < 5 5- < 7 7- < 9 9- < 11 11- < 15 15- < 25 0.0806 0.0484 0.0645 0.0403 0.0121 0.0065 3
Step by Step Solution
3.45 Rating (164 Votes )
There are 3 Steps involved in it
a b No c The class interval wi... View full answer

Get step-by-step solutions from verified subject matter experts