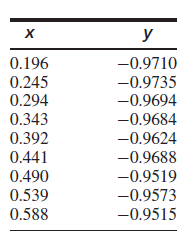
Question: The article Drift in Posturography Systems Equipped with a Piezoelectric Force Platform: Analysis and Numerical Compensation (L. Quagliarella, N. Sasanelli, and V. Monaco, IEEE Transactions

a. Compute the least-squares line for predicting y from x.
b. Plot the residuals versus the fitted values. Does the least-squares line seem appropriate?
c. Compute the least-squares line for predicting y from x2.
d. Plot the residuals versus the fitted values. Does the least-squares line seem appropriate?
e. For each model, find a 95% confidence interval for the mean value of y when x = 0.32. Are the confidence intervals similar?
y 0.196 -0.9710 0.245 0.294 -0.9735 -0.9694 0.343 -0.9684 0.392 -0.9624 0.441 -0.9688 0.490 -0.9519 0.539 -0.9573 0.588 -0.9515
Step by Step Solution
3.41 Rating (160 Votes )
There are 3 Steps involved in it
a y 09853 05483x b One residual is somewhat large The model seems appropriate c y 097... View full answer

Get step-by-step solutions from verified subject matter experts


