

Question: The following table lists values for three variables measured for 60 consecutive eruptions of the geyser Old Faithful in Yellowstone National Park. They are the
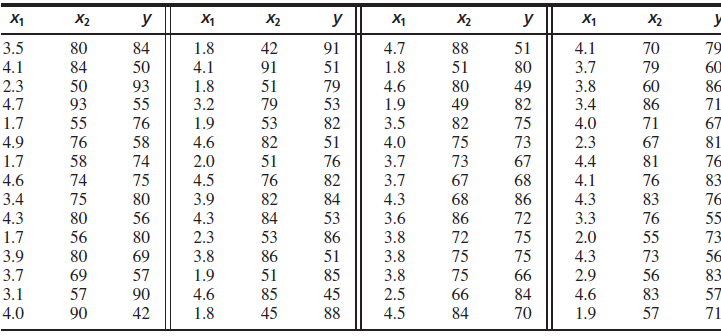
a. Compute the least-squares line for predicting the duration of the dormant period following an eruption (y) from the duration of the eruption (x1). Is there a linear relationship between the duration of an eruption and the waiting time until the next eruption occurs?
b. Compute the least-squares line for predicting the duration of the dormant period following an eruption (y) from the duration of the dormant period preceding the eruption (x2). (You already did this if you did Supplementary Exercise 3 in Chapter 7. The results in this problem will be slightly different, since there are 60 points instead of 59.) Is there a linear relationship between the duration of the dormant period preceding an eruption and the waiting time until the next eruption occurs?
c. Fit the multiple regression model that includes both the duration of the eruption x1 and the duration of the dormant period preceding the eruption x2 as independent variables.
d. If you could find the value of either x1 or x2 but not both, which one would you want to know to predict y?Would it help much to know the other one as well? Explain.
X2 y X2 y X1 X1 X1 X2 y X1 X2 42 4.7 3.5 80 84 1.8 91 88 51 4.1 70 79 4.1 84 50 4.1 91 51 1.8 51 80 3.7 79 60 2.3 4.7 50 93 93 55 1.8 3.2 51 79 79 53 4.6 1.9 80 49 49 82 3.8 3.4 60 86 86 71 1.7 55 76 1.9 53 82 3.5 82 75 4.0 71 67 4.9 76 58 4.6 82 51 4.0 75 73 2.3 67 81 1.7 58 74 2.0 51 76 82 3.7 73 67 4.4 81 76 76 74 3.7 68 4.6 75 4.5 76 67 4.1 83 3.4 75 80 3.9 82 84 4.3 68 86 4.3 83 76 4.3 80 56 4.3 84 53 3.6 86 72 3.3 76 55 1.7 56 80 2.3 53 86 3.8 72 75 2.0 55 73 3.9 80 69 3.8 86 51 3.8 75 75 4.3 73 56 3.7 69 57 1.9 51 85 3.8 75 66 2.9 56 83 45 3.1 57 90 4.6 85 2.5 66 84 4.6 83 57 4.0 90 42 1.8 45 88 4.5 84 70 1.9 57 71
Step by Step Solution
3.44 Rating (167 Votes )
There are 3 Steps involved in it
a Yes there is a linear relationship b Yes there is a ... View full answer

Get step-by-step solutions from verified subject matter experts