

(a) Use the data from the following figure, which are reprinted from the Home News of November...
Question:
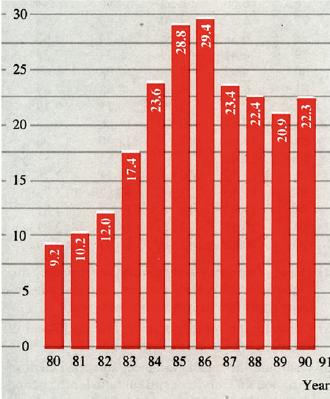
(a) Use the data from the following figure, which are reprinted from the Home News of November 17, 1991, to calculate the mean, standard deviation, and Z score of Newark International Airport’s passenger traffic trends for the period 1980–1990.
(b) What do the Z scores you obtained in part (a) suggest?
Fantastic news! We've Found the answer you've been seeking!
Step by Step Answer:

Answered By
Sheikh Muhammad Ibrahim
During the course of my study, I have worked as a private tutor. I have taught Maths and Physics to O'Level and A'Level students, as well as I have also taught basic engineering courses to my juniors in the university. Engineering intrigues me alot because it a world full of ideas. I have passionately taught students and this made me learn alot. Teaching algebra and basic calculus, from the very basics of it made me very patient. Therefore, I know many tricks to make your work easier for you. I believe that every student has a potential to work himself. I am just here to polish your skills. I am a bright student in my university. My juniors are always happy from me because I help in their assignments and they are never late.
14+ Reviews
24+ Question Solved
Related Book For 

Statistics For Business And Financial Economics
ISBN: 9781461458975
3rd Edition
Authors: Cheng Few Lee , John C Lee , Alice C Lee
Question Posted:
