

Consider the plot of power as a function of the allocation ratio, $r$, for the two-sample z-test
Question:
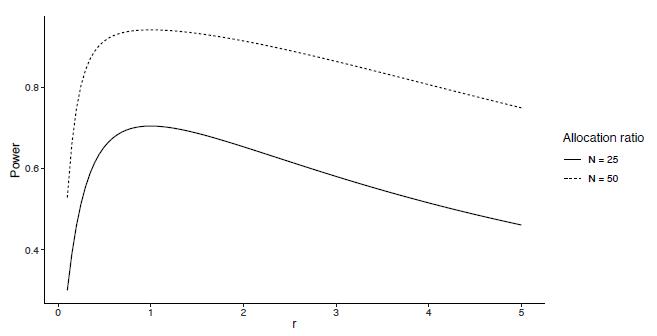
Consider the plot of power as a function of the allocation ratio, $r$, for the two-sample z-test shown in Figure 4.4 and the $\mathrm{R}$ code for generating plot.
a. Recall that $\mathrm{n}$ is the total sample size for the function pow_ztest(). What does $\mathrm{n} 2$ represent, and why is it $\mathrm{n} /(\mathrm{r}+1)$ ?
b. Does sample size imbalance between the two groups lead to an increase or decrease in power? Explain.
c. Modify the function pow_ztest() to return the value of $\mathrm{n} 2$ and plot $\mathrm{n} 2$ versus r. Describe the relationship between the two variables.
Data from Figure 4.4
Step by Step Answer:

This question has not been answered yet.
You can Ask your question!
Related Book For 
Design And Analysis Of Experiments And Observational Studies Using R
ISBN: 9780367456856
1st Edition
Authors: Nathan Taback
Question Posted:
