

In Example 8.4 (Section 8.2) we used the two-sample t-statistic to compare the success indexes of two
Question:
In Example 8.4 (Section 8.2) we used the two-sample t-statistic to compare the success indexes of two groups of managers. The data are repeated in Table 8.9 for convenience. The use of the t-statistic was based on the assumption that the population variances of the managerial success indexes were equal for the two groups. Conduct a test of hypothesis to check this assumption at α = .10.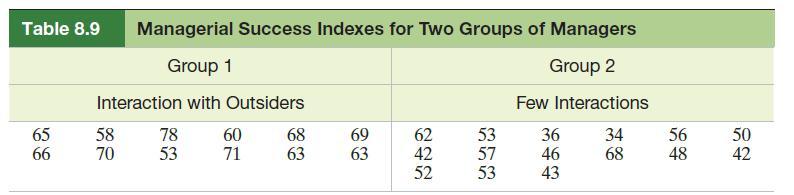
Example 8.4
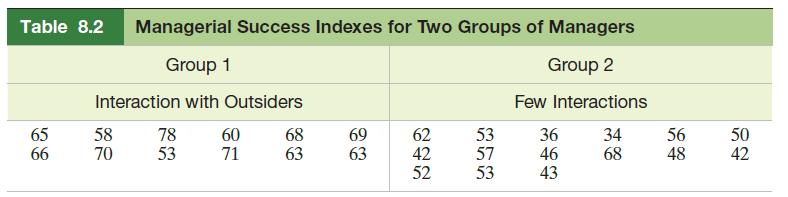
Behavioral researchers have developed an index designed to measure managerial success. The index (measured on a 100-point scale) is based on the manager’s length of time in the organization and his or her level within the firm; the higher the index, the more successful the manager. Suppose a researcher wants to compare the average success index for two groups of managers at a large manufacturing plant. Managers in group 1 engage in a high volume of interactions with people outside the manager’s work unit. (Such interactions include phone and face-to-face meetings with customers and suppliers, outside meetings, and public relations work.) Managers in group 2 rarely interact with people outside their work unit. Independent random samples of 12 and 15 managers are selected from groups 1 and 2, respectively, and the success index of each is recorded. The results of the study are given in Table 8.2.
Step by Step Answer:
We want to test This Ftest is shown on the ExcelXLSTAT printout Figure 821 Both the test statisti...View the full answer


Statistics For Business And Economics
ISBN: 9781292227085
13th Global Edition
Authors: Terry Sincich James Mcclave, P. George Benson
