

In this Activity, For convenience, the table shown in that activity is repeated here. 1. Determine whether
Question:
In this Activity, For convenience, the table shown in that activity is repeated here.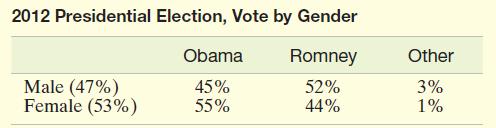
1. Determine whether the table above and the similar tables that you found for Activity 3.1 are contingency tables. If not, do you have enough information to create a contingency table for the data? If you need more information, state specifically what information you need.
2. Choose one of your examples from the previous activity if it contains a contingency table or enough information to create one, or use the Internet or some other source to find a new example with a contingency table given.
Determine whether the conditions for a valid x2 test are met. If not, choose a different example where the conditions are met.
3. Perform a x2 test for independence for the example chosen in Exercise 2. Are the results what you would expect in the given situation? Explain.
Activity 3.1
Exit polls are conducted in selected locations as voters leave their polling places after voting. In addition to being used to predict the outcome of elections before the votes are counted, these polls are used to gauge tendencies among voters. The results are usually stated in terms of conditional probabilities.
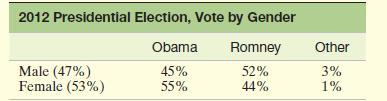
The table below shows the results of exit polling that suggest men were almost evenly spit on voting for Mitt Romney or Barack Obama, while women were more likely to vote for Obama in the 2012 presidential election. In addition, the table also suggests that more women than men voted in the election. The six percentages in the last three columns represent conditional probabilities where the given event is gender.
1. Find similar exit poll results where the voters are categorized by race, income, education, or some other criterion for a recent national, state, or local election (e.g., the 2016 national election). Choose two different examples and interpret the percentages given as probabilities, or conditional probabilities where appropriate.
2. Use the multiplicative rule of probability to find the probabilities related to the percentages given. [For example, in the table on the left find P(Obama and Male) using the multiplicative rule.] Then interpret each of these probabilities and use them to determine the total percentage of the electorate who voted for each candidate.
3. Describe a situation where a business might use a form of exit polling to gauge customer reaction to a new product or service. Identify the type of business, the product or service, the criterion used to categorize customers, and how the customers’ reactions will be determined. Then describe how the results will be summarized as conditional probabilities. How might the results of the poll benefit the business?
Step by Step Answer:


Statistics For Business And Economics
ISBN: 9781292227085
13th Global Edition
Authors: Terry Sincich James Mcclave, P. George Benson
